READ THIS TO UNDERSTAND PREDICTIONS AND REVERSALS
Counting Steps, Money Management, & Death of a Gunslinger
In this section, you will read about counting steps, money management, Death of a Gunslinger, and other miscellaneous ideas. I personally find it helpful to reread this section as a guidance reminder. We do forget things and this is a reminder for even the professional
When reading about counting the steps, please don’t move on to another section or paragraph if you don’t understand the present illustration or example. Go back and reread the current section and try to visualize what is illustrated. Do this repeately until you understand the section.
Don’t miss Bob’s thrilling real-life adventures trading in the stock market, from his early days as a teenage speculative “genius” to becoming a true gunslinger on Wall Street. “Death of a Gunslinger” is a true story of how a teenager evolved into a gunslinger routinely trading 25 milllion dollar contracts (pit traded SP 500 contracts $500 per point). As usual, it’s a true rags to. riches, back to rags story. There are many interesting tales in this autobiography of Death of a Gunslinger and is well worth your time.
Death of a Gunslinger
. . . In 1976 I discovered a new method of counting waves.
There wasn’t much in the way of wave counting methods in the 1970s other than the Elliott Wave Theory. For want of a better name I have named my wave count method, Karrow’s Wave Theory.
The following is Edson Gould’s verbatim wave counting technique as published in “Findings & Forecasts”. “Findings & Forecasts” was Edson Gould’s advisory service. His wave counting is a simple method and relatively good, but prone to mistakes and it doesn’t explain the detailed breakdown of a wave counting event. Every bull and bear market is different and the details of the wave count can’t be explained by Edson Gould’s technique.
————————————————
THE THREE-STEP RULE as written by Edson Gould
QUOTE
“The theory, hypothesis, and assumption that the stock market is essentially a reflection of investor psychology have led to the development of a number of principles and theories that over the years have yielded practical results.
The Three Step Rule is one example. The rule is: “Expect three steps but be prepared for a fourth. ” It is based on the principle that man, individually and in mass, can usually tolerate only three attempts. The typical salesman, after ringing three doorbells and getting turned down, will go to the movies. The typical fighter, after being knocked down three times, stays down. If the salesman, after three failures, makes his fourth call or if the fighter gets up after the third knockdown, they are likely respectively to become a sales manager or champion.
So it is with the market. Short-term, intermediate-term, and long-term moves usually comprise three well-defined steps. But sometimes there is a fourth.”
UNQUOTE
————————————————
Edson Gould was a wave counter, but it’s debatable to what extent he counted waves??? His real-time wave counting techniques as revealed on his charts were cloudy and unexplained. If he had a more detailed and precise technique, it was never revealed in his writings (“Findings and Forecasts”).
I wish Gould had documented his techniques to be published after his death, but it never happened.
Knowledge has a terrible habit of evaporating after a person’s death.
I have a lot of Edson Gould’s published reports from “Findings and Forecasts”, 1973 to 1979. There was a LOT of repetition in his biweekly reports and consequently, I didn’t keep everything that he wrote, but I kept everything important.
During the period that I was subscribing to Gould, 1973 to 1979, I discovered a different method of wave counting that was simple and precise, plus the method doesn’t change between an up or down market (bull or bear). Prior to this period I had tried Elliott Wave counting and found it was OK in hindsight, but terrible in real time. The Elliott exclusions and exceptions were so many that one could draw any conclusion that was deemed necessary. This is the reason why a leading Elliott Wave technician has continually called for a catastrophic ending of the bull market. I have little doubt that he will be eventually correct, but in the meantime, he has missed the beginning of a lot of market action. His method has caused him to react rather than predict the market.
In 1982, the leading Elliott Wave technician was perfect in calling the beginning of the bull market. I too was a major bull at the August 1982 bottom and missed the exact bottom by being 2 days early. I had to sweat out the declines of Thursday and Friday before the Monday launch of the bull market.
Needless to say, I discarded Elliott Wave after having high hopes.
KARROW’S WAVE THEORY
After my breakthrough discovery of a new wave counting technique (late 1976), I found that KARROW’S WAVE THEORY was at odds with Edson Gould’s previous wave counts. It was the problems in Gould’s method of wave counting that forced me to invent a different method. For instance, he labeled step 3 of the 1973-1974 bear market as ending in December 1974. My method determined that the October 1974 bottom was the end of step 3, which ended the 1973-1974 bear market.
The rally from October 1974 was step 1 up in the new bull market that began in Oct 1974.
How did I conceive of the new wave counting technique???
In 1976 using Gould’s method of wave counting, I was left hanging waiting for a 3rd step up that never appeared. This was a major problem as I was still holding stocks long as the market began a deep correction after the 1976 peak. I was not too happy with this result.
Here it comes, the new and improved Karrow’s Step Theory invented in 1976
If you look at the chart below and begin counting the steps up after December 1974, you will see there are only 2 steps up to its peak in 1976. I have labeled the steps correctly in the chart below, which shows 3 distinct steps down after January 1973 and then 3 steps up to the 1976 peak. BOOM, this is the thought evolution leading to Karrow’ Step Theory in 1976.

1970 to 1978 DJ INDUSTRIALS
As a result of waiting for a step that never came, I researched the steps in the past and arrived at KARROW’S WAVE THEORY.
Gould states: ““Expect three steps, but be prepared for a fourth.”
I agree with the 3 steps but totally disagree with the 4th step. There is either a 3 step, or a 5 step for a completed rally, or decline. More on a 5-step later.
The first two large steps up after the 1974 bottom were the precursor to the great bull market that kicked off in step 3, which began in August 1982 and continued until 2000. Step 1 was from October 1974 to 1976, step 2 was from 1978 to 1981, and step 3 was from 1982 to 2000.
Since the traditional bull market peak in 2000, we have had 2 bear markets that resulted in steps 4 and 5 up. The result is a megaphone formation since 2000. Incidentally, Edson Gould never used the term megaphone formation in his publication, “Findings & Forecasts”. Megaphone is a term that I used in several emails to Terry Laundry of T-Theory.
The charts below show the megaphone formation that we have to date (March 2017). After clicking on the chart below, you may need to click the resulting chart again to enlarge it fully.
(edit 2021) Step 5 up has become an extended and complex wave structure. It is very similar to the complex wave from 1982 to 2000, which was a series of extending upward market structures. In real time, it is very difficult to label a complex wave structure like 2000 and 2021. You simply follow the trend and trendlines to their conclusion.

Megaphone Formation 2014
Edson Gould died in 1987 prior to the market crash of October 1987. It would have been nice if he could have lived to see the bull market to 2000 that he correctly called in 1974. He was a GREAT stock market technician (the greatest of the 20th century, maybe of all time)
*************************************************************************************************
KARROW’S WAVE THEORY
FIRST IMPORTANT CONCEPT
KARROW’S WAVE THEORY consists of 3 steps up and 3 steps down. 3 steps down is a conflicting idea with just about all wave counting methods that exist today.
But first a few rules
- KARROW’S WAVE THEORY IS NOT ELLIOTT WAVE
- Forget about Elliott when looking at my wave counts or you’ll NEVER understand the simplicity of the concept.
- KARROW’S WAVE THEORY is simple and functions without a maze of exclusions (but it does have ONE exception, unlike Elliott Wave, which has a multitude of exclusions and exceptions and allows wave counts to proceed in many different directions).
- I like things simple and I am a strict believer in KISS (keep it simple & stupid).
————————————————————–
Here is how KARROW’S WAVE THEORY works:
- THERE ARE 3 PEAKS (OR DIPS) TO A COMPLETED WAVE COUNT.
- AFTER A COMPLETED 3-WAVE COUNT THERE WILL BE A REVERSAL OF THE TREND.
- Sometimes it’s as simple as counting 3 rallies (or 3 declines) on a chart . . . other times, not so easy, requiring more scrutiny.
- In a downtrend, the same rules apply except you are counting 3 declines instead of 3 rallies up.
- To verify the wave counts, we have the CHANNEL CONCEPT. Staying within the channel verifies a continuous wave. This is an important concept and it rules the waves like Captain Bligh of mutiny on HMS Bounty fame.
- 3 steps must stay confined to a channel. On a long wave, a log chart may be required to see the channel.
- Laying a straight edge on the chart will help you visualize the channel. Try it. It works.
- As the larger trend progresses, all of the steps (or waves) that make up the overall trend will be confined to a larger channel.
- When the market breaks its channel, regardless of the perceived wave count, the step is FINIISHED. For small or large channels, this is true.
- In a lengthy wave extension (5 steps), breaking the channel may be your best or only indicator that the wave count has been completed. This usually will be a product of a long bull market like 1982 to 2000.
- Here comes an exception (I hate exceptions) . . . 1 of the 3 waves can sub-divide into another 3 waves. I call this an extension. Extensions are frequently the rule rather than the exception during a bull market.
- When an extension takes place: (1) the trend is still intact, (2) the overall channel will likely widened and (3) instead of a total of 3 steps, there will be 5 steps.
- Why 5 steps and not 4 steps???
-
An illustration: You have 3 steps in a completed wave. ONE of these 3 steps subdivides into ANOTHER 3 steps. You now have the two original steps plus the original third step, which has evolved into 3 more steps. This makes a total of 5 steps, which breaks down as: 2 original steps + the 3rd original step, which now consists of 3 more steps = 2 steps + 3 more steps = 5 steps). Clear as mud??? I hope not, but try to visualize it, or use a paper and pencil and draw the illustration of what I’m saying and you’ll get it.
- Extensions during a bull market can occasionally take a long time to complete the count. The 1990s was an excellent example of never-ending subdivisions. Correctly tracking the wave count can become almost impossible during continuous subdivisions (the 1990s). The breaking of a wave channel will be the only conclusive clue that the wave has terminated.
- There are always trends within trends from the short term of a few days to the super long-term trend that may last centuries. Bringing it all together gives you a remarkable market perspective. I love perspective as it tells you the expected magnitude of an upcoming trend.
- The correction following the second step is usually larger/longer than the correction that followed the first step. First step correction is brief and sometimes almost undetecable.
- Frequently I will use the terms “step” and “wave” interchangeably. But I usually think of (1) a step as shorter in duration, (2) a wave consists of steps and is longer term than a step; such as there are 3 steps to a wave.
- The steps/waves fit inside one another like a matryoshka (Russian nesting doll).
- THE FOLLOWING IS ALSO AN IMPORTANT CONCEPT OF KARROW’S WAVE THEORY
- At the conclusion of a 3-step (or 5 step) trend, there will be a corrective countermove. This counter move MUST be of sufficient amplitude (or duration) to BREAK THE CHANNEL of the prior 3/5 steps.
- Something to keep in mind. If a channel break doesn’t occur after the corrective counter move is finished, you’ve probably miscounted the steps and the previous trend is probably still intact.
- Breaking the channel is a very important concept. If a channel wasn’t broken, it can be the only clue that your wave count was incorrect.
- (edit 1/3/19) Here comes another exception (damn another one, I hate these things) . . . In other blog updates like “Death of a Gunslinger”, you can read how things really went wrong for me in 1987. The reason is this exception. Up until 1987, every step resulted in a lower low or a higher high. In 1987, the countable steps didn’t always result in a lower low. This naturally threw my count off. In this exception, every downward impulse should have been counted as a step. So beware of the possibility that a downward or an upward impulse is sometimes good enough to warrant a step count even if it doesn’t result in a lower low or higher high. If I had used this principle in 1987, the results would have been extremely different, but I wouldn’t have learned the lesson about using too much leverage. That unlearned lesson would likely have killed me at some later date and the money lost undoubtedly would have been far greater. Why??? Because the ideas learned in “Death of a Gunslinger” wouldn’t have taken place in 1987 and my string of unbroken profits would have likely carried on for many more years, resulting in an even larger amount of money lost when the lesson of TOO MUCH LEVERAGE WAS LEARNED.
- Nobody ever talks about their losses, always their profits. If they don’t admit to being taken out to the woodshed and having the crap beat out of them . . . they are liars. It’s a pillar of truth from Wall St that newbies always get beat up until they learn how to manage their risks. A newbie would be anyone that hasn’t been to the woodshed. It took me from 1955 to 1987 to stop being a newbie, 32 years (almost a Fibonacci number). In 1987 I was a giant in speculation but had forgotten humility. It was the ARROGANCE of losing humility that cost me a fortune. Keep the perspective of your risk in mind at all times.
- I can’t stress enough the idea of not trusting a teaching source for Wall Street wisdom if they don’t profess to losing lotsa money on their way to the present. IT’S A FACT OF LIFE ON THE STREET. Everyone goes to the woodshed to have the hell beat out of them at some point in their investment career.
————————————————————–
- Below is a chart of a subdivided wave with a total count of 5 steps.
- In this chart, the real uptrend ended at the conclusion of the 3rd step. Steps 4 and 5 were part of a topping formation (sawtooth). Steps 4 and 5 don’t have to be part of a topping formation, it just happened to be true in this example. Occasionally 4 and 5 can be part of a blow-off phase. Notice the use of the Pitchfork in denoting the channel in the chart below. Sometimes pitchforks are useful in denoting the channel, but they don’t always work properly.

08-27-11 FIVE-STEP TREND
END OF KARROW’S WAVE THEORY
*************************************************************************************************
MONEY MANAGEMENT – BRESSERT’S SYSTEM
SECOND IMPORTANT CONCEPT
- The following is an edited version of Walter Bressert’s money management system. This is a very useful idea for managing money in either the STOCK or commodity market.
- To put this into action, you must scale the figures to fit your situation. It’s necessary to think of your purchase as consisting of three parts. Bressert’s example uses 3 futures contracts, but a similar concept scaled into three equal parts works for stocks. If you were going to buy 300 shares of stock, you think of your purchase as consisting of three blocks of 100 shares each. You can buy all 300 shares at one time, but you will sell the 300 shares at different times.
- MONEY MANAGEMENT
- All three contracts can be entered at once, or bought at different times and price levels.
- Contract No. 1: The Money Contract
- The first contract, called the Money Contract, is the most important.
- Profits on the money contract should be taken as quickly as possible.
- When the money contract is liquidated, your risk is lowered and you have closed profits in your account.
- Contract No. 2: The Short-Term Profit Objective Contract
- The Short-Term Contract is designed to take profits at a short-term objective. This can be the crest/trough of a trading cycle or a preset objective. Liquidate the contract as prices approach your price objective or move stops closer and let the market take you out.
- Contract No. 3: The Long-Term Profit Objective Contract
- The purpose of the Long-Term Contract is to keep you in the market for the BIG moves. Assuming you have liquidated your other two contracts at a profit will give you breathing room during the corrective phase. The purpose of the Long- Term Contract is to comfortably ride with the market until your long-term price objective is reached. That objective can certainly be different for everyone. For me, when the market has reached a “possible” major reversal point or during a major 3rd step, I am unlikely to hold an investment position for long due to the possibility of a significant reversal taking place. After that point, I will trade frequently instead of remaining long-term following Contract 1 and 2 rules.
- As the correction is ending, three more contracts are bought for a total of four contracts. You now have two Long-Term Contracts, one Money Contract, and one Short-Term Profit Objective Contract.
- With the purchase of 3 new contracts, you repeat the same scenario outlined above. Liquidate the Money Contract and the Short-Term Profit Objective Contract as they meet your short-term objectives. The two Long-Term Contracts are held expecting higher prices as the long-term objective is met.
- You keep repeating this scenario until the bull/bear market is finished or a major correction is anticipated.
- If you fail to purchase 3 new contracts as a correction ends, you will have your Long-Term Contracts and can still participate on a primary direction move.
- Should the market fail to reach your long-term price objective, fail-safe stops will liquidate your long-term position. Assuming all goes well, the remaining Long-Term Contracts can be liquidated at different price levels as the long-term objective is met.
*************************************************************************************************
DEATH OF A GUNSLINGER
THIRD IMPORTANT CONCEPT
Remembering humility and taming arrogance. Read DEATH OF A GUNSLINGER to understand pitfalls that might come your way
*************************************************************************************************
MISCELLANEOUS CONCEPTS
Advance Decline Line
- This is a running total of the daily net advancing stocks (total advancing stocks minus total declining stocks). As it rises it indicates that there are more advancing stocks than declining stocks. The opposite is true when the line falls. The advance-decline line will usually top out before prices are in the end stage of a bull market. This is caused by fewer and fewer stocks participating in the advance. Unfortunately, this doesn’t hold true for a bear market. A bear market will usually have a sudden climactic ending stage that will be tested at a later date and the advance-decline line may, or may not diverge from prices.
Bottoms
- Market bottoms occur with a bang or a whimper.
- Ending with a bang, the market loses a large number of points in just a few hours (or days). This is characterized as climactic because of the high volume and high volatility.
- Ending a decline with a whimper, the market will be “sold out” and trading in a dull manner. The decline will have exhausted most of the seller’s supply of stock and buyers will be moving in a tepid manner. This is a classic “dull” market, which usually lasts a couple days. It is characterized by low volume and low volatility. From this type of market rose the Wall Street axiom, “Never short a dull market”.
Buy/Sell Process
- The buy/sell process should be completed during a bottoming process (with stops) or immediately upon the breakaway. Each day after the breakaway takes place subjects one to a greater loss if a misinterpretation of the trend has taken place.
- A STOP protects a position from further loss when a mistake has been made. I normally place a STOP below the prior important low (above the prior important high for a short). A STOP also means you don’t need to watch your security constantly. Sleep comfortably knowing nothing is going to hurt you unnecessarily.
- Remember that for every stock sold, there is a buyer on the other side of the transaction, and both buyer and seller believe they are correct in their actions.
Commodity Contracts
- Regardless of how much money you have, if you have never invested in a futures contract, NEVER BUY OR SHORT MORE THAN ONE CONTRACT. Learn how commodity trading can be very damaging to your financial health before buying any contracts and never more than one contract. One of the great features of the SP 500 futures contracts is that it gives you access to the market almost 24 hours per day. Gap openings become a thing of the past for you.
- There is something different emotionally in trading the stock market contracts. If you find yourself trading in an unusual manner (and losing money), step back and re-evaluate your situation. The contracts have a thrill unto themselves and it can result in a gambling thrill. So watch out and be forewarned.
- Currently (2012) the margin cost of one SP futures contract is $5,000. Additional capital is also required and many firms require over $10,000 to open a commodity account. A one-point move in the SP 500 index is a 1% fluctuation of your invested capital or $50 per contract. A move of 20 points in one day is not unusual and represents 20% of your invested capital ($1,000, 20 X $50). It’s easy to see how you can lose a significant percentage of your money trading futures contracts. As the market moves against you, margin calls automatically take place on a daily basis. This is ample reason for never trading commodity contracts. But if you must, but only 1 contract UNTIL you have experienced hard times in the futures market. There is no better teaching tool regarding the stock commodity market than losing money.
- Currently (2012), the value of one futures contract is about $70,000 worth of stock. When you trade futures contracts you never want to exceed the amount of money that you would have invested in stocks. It’s very easy to over-leverage yourself in the futures market. Remember, leverage is a double-edged sword and definitely will cut both ways. In other words, if you had $70,000 to invest, you would only buy 1 contract and NEVER more than 1 contract. Not following this advice is a good recipe for losing ALL of your money.
Confidence Index or Sentiment Index
- The sentiment/confidence index is the ratio of high-grade bonds (AAA) to low-grade bonds (junk bonds). As this indicator rises, it shows confidence that junk bonds will not default and investors are buying junk for the higher yield. The opposite is true as this indicator falls. Normally a rising line takes place as the economy is improving. A falling line takes place as the economy weakens.
- This index coincides with the overall trend of the market. It “can” peak before the overall market and give an early warning.
ETF
- An exchange-traded fund (ETF) is an investment fund traded on stock exchanges, much like stocks. An ETF holds assets such as stocks, commodities, or bonds, and trades close to its net asset value over the course of the trading day. Most ETFs track an index, such as the S&P 500.
Fibonacci Fans or Radials
- Fibonacci fan lines are trend lines based on Fibonacci percentages. Draw the primary rising Fibonacci fan line from a trough to a peak. The opposite is true for a falling Fibonacci fan line, drawing from a peak to a trough. These fan lines estimate support levels or potential reversal areas. The first fan line is the primary line drawn from peak to trough, or trough to peak, and is the 100% line (rising or falling at full speed, 100%). The other lines are 38.2%, 50%, 61.8%, and 78.6%, which rise or fall as a percentage of the primary line (100%). Edson Gould referred to these lines as “Speedlines” and used them in his publication, “Findings and Forecasts”. He illustrated how lines based on important market turning points could influence the market for years.
Lines
- Any line whether it is a trend line, fan line, or retracement line is a possible support or resistance area.
Limit Order
- A limit order is an order to buy or sell a stock at a specific price or better. A buy limit order can only be executed at the limit price or lower, and a sell limit order can only be executed at the limit price or higher. A limit order is not guaranteed to execute. A limit order can only be filled if the stock’s market price reaches the limit price.
London Stock Exchange Index (FTSE)
- This stock market index can give an early warning to the movement of the US markets. It should be closely watched.
Long-Term Tax Status
- I buy short term and as the trend continues, the short-term holding turns into long-term (see money management).
Marked To The Market (Futures)
- The norm for futures trading.
- Process of daily revaluation of a security to reflect its current market value instead of its acquisition price or book value. With futures, marking to the market can entail adding or subtracting money to your cash account on a daily basis as profit or losses widen. The additional money can be used to purchase additional securities, but your margin vulnerability rises also. It almost has the effect of buying/selling your security on a daily basis but without the impact of commissions.
Margin, Futures
- The key to understanding margin is to recognize that it is not an extension of credit. The initial margin is not the amount required to secure a loan made to the customer to purchase a security or to provide collateral to borrow stock sold short. Rather, it is a performance bond designed to assure the broker and the clearinghouse that the futures contract will be performed.
Margin, Initial
- The initial margin is the amount of margin (money) required by the broker when a futures position is opened.
Margin, Maintenance
- The maintenance margin is an amount that must be maintained on deposit at all times. If the equity in a customer’s account drops to or below the level of maintenance margin because of adverse price movement, the broker must issue a margin call to restore the customer’s equity to the initial level.
Market Order
- A market order is an order to buy or sell a stock at the best available price. Generally, this type of order will be executed immediately. However, the price at which a market order will be executed is not guaranteed and is usually dependent on the liquidity of the stock. Watch out in thin markets for market orders.
Megaphone Formation
- A megaphone chart formation is one that has higher highs and lower lows. It is a vertical and widening formation as time progresses. The first chart is a megaphone formation that has been underway since 2000. The second chart is the megaphone formation that defined 1966 to 1974. During the ’66-’74 megaphone each bear market down thrust was worse than the preceding one. That also has been characteristic of the two bear markets since 2000.
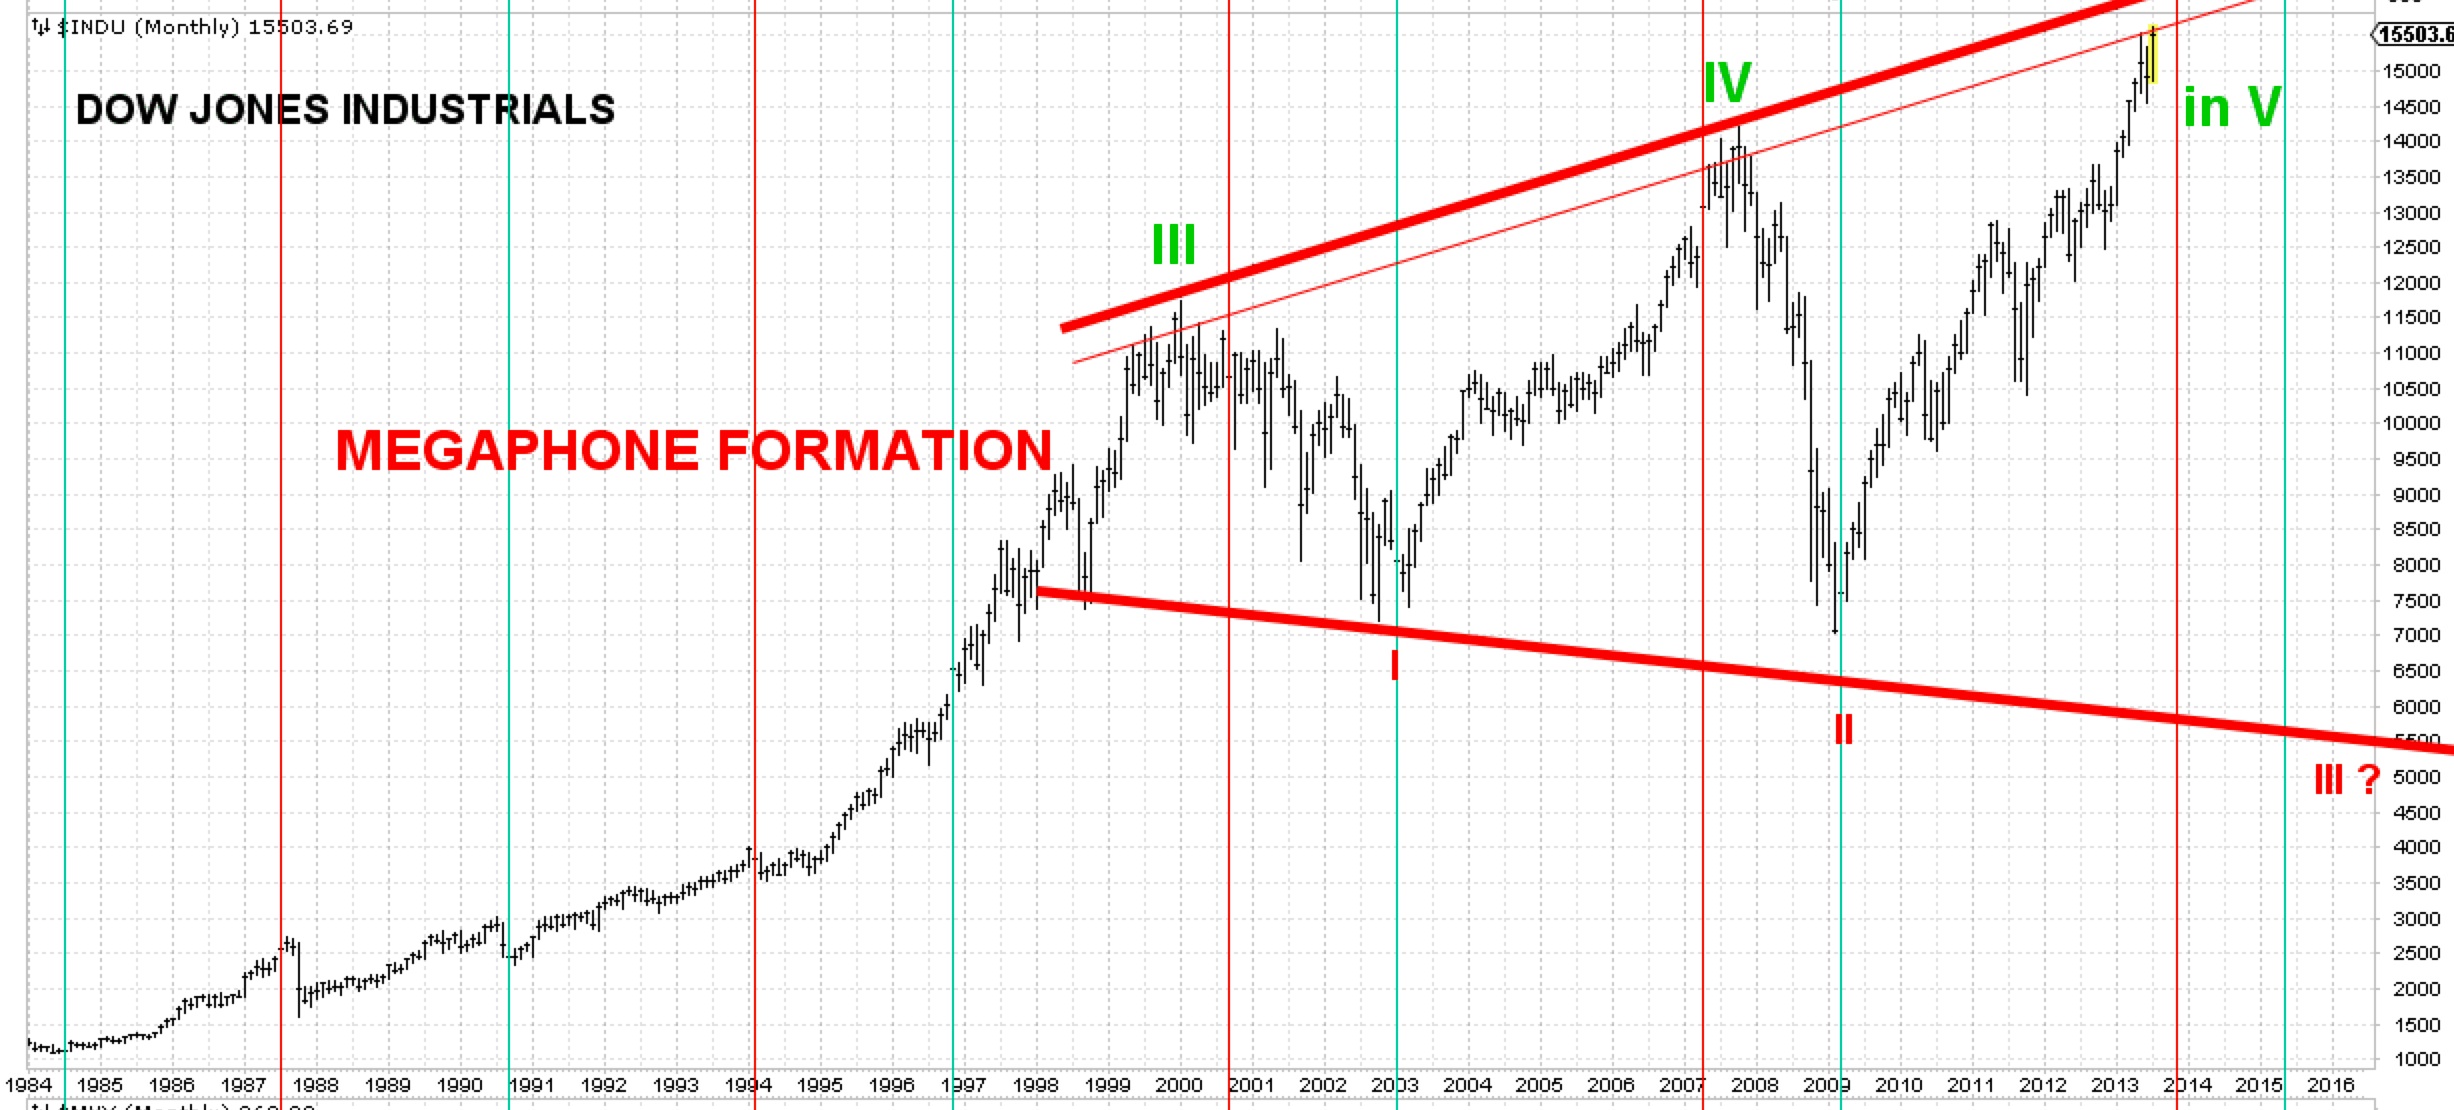
7-31-13 MEGAPHONE FORMATION

Megaphone Formation 1966 to 1974
News
- How the market reacts to news is very important. If the market receives bad news and shrugs it off quickly and rises, this is bullish. The reverse is also true. If the market receives good news and declines, this is bearish.
S & P 500 Futures
- Occasionally I will refer to the SP 500 futures. This is a commodity contract, which trades exactly like the S&P 500 index. Its symbol is ES. The futures contract trades almost 24 hours per day. Because it trades constantly there are normally no large gaps up or down. The regular S&P index often has large gaps with the opening trades of the day. The futures have a smoother-looking chart and usually more accurate wave counts.
Short Sale
- A short sale is generally the sale of a stock that you don’t own. Investors who sell short believe the price of the stock will decline. If the price drops, you can buy the stock at a lower price and make a profit. If the price of the stock rises and you buy it back later at a higher price, you will incur a loss.
- When you sell short, your brokerage firm loans you the stock. The stock you borrow comes from either the firm’s own inventory, the margin account of one of the firm’s clients, or another brokerage firm. As with buying stock on margin, you are subject to margin rules. Other fees and charges may apply. If the stock you borrow pays a dividend, you must pay the dividend to the person or firm making the loan.
Short Covering Rally
- A rally that is very powerful as the short-seller replaces borrowed stock. When the fear of a rally is high, short covering is done with a market purchase order. These market purchase orders have the ability to move the market strongly upward, especially when there are few sellers. This in turn causes the short-covering rally to feed on itself, going higher and higher as more and more shorts become fearful.
Significant Penetration
- A penetration that continues throughout the day (every hour is up, or every hour is down)
- A penetration on high volume that continues into the following days
- A penetration that closes above/below the support/resistance area with a move of more than 1%
Step 1 Correction
- The correction following step 1 is usually brief and shallow. It frequently will only have a single thrust.
Step 2 Correction
- It’s normal for the correction following step 2 to be deeper and longer than the step 1 correction. In the bull market rally from 2003 to 2007, the step 2 correction lasted almost one year, from Jan 2004 to Jan 2005. A step 2 correction is usually made up of 3 thrusts (or steps).
Step 3 Correction
- The correction following step 3 will correct the entire preceding 3-step rally (or decline). A correction of 38% to 62% is normal.
- The steps are cumulative, and steps built upon other steps forming larger steps will correct in a similar and proportional manner. In other words, 3 steps that lasted 3 years will have a much larger correction than 3 steps that lasted only 3 months.
Stop Order
- A stop order is also referred to as a stop-loss order. It is an order to buy or sell a stock once the price of the stock reaches a specified price, known as the stop price. When the stop price is reached, a stop order becomes a market order. A buy stop order is entered at a stop price above the current market price. Investors generally use a buy stop order to limit a loss or to protect a profit on a stock that they have sold short. A sell stop order is entered at a stop price below the current market price. Investors generally use a sell stop order to limit a loss or to protect a profit on a stock that they own. I ALWAYS use Stops. After hours trading of the SP 500 futures contract does not allow market orders. You must use a Stop to execute a market order during after hours trading.
Taxes, Futures Contracts
- Since 1981 everyone that trades futures contracts enjoys favorable tax treatment (IRS form 6781, “Gains and Losses From Section 1256 Contracts and Straddles”. PDF example follows.
- IRS Form 6781
- Commodities futures contracts are taxed on a 60/40 basis, where 60 percent of the gains are taxed as long-term gains and 40 percent of the gains are taxed as short-term gains. This is regardless of the holding period be it 1 hour, 1 day, or 1 year.
Tops
- Tops are harder to identify than bottoms as they occur over an extended period of time. As a top unfolds, stock is moving from “strong” hands to “weak” hands. The “strong” hands selling process is disguised so that the seller can receive the best possible price.
- The wave count can be a helpful tool in pinpointing a top and is a “finesse” tool.
- Most topping indicators are non-specific to the date of the actual peak. These indicators will normally have several non-confirmations that indicate we are in an area of a top. They lack finesse.
Trend Lines
- A trend line is a straight line that connects two or more price points and extends into the future to act as a line of support or resistance. It identifies the primary direction or trend. A parallel trend line drawn from other peaks or troughs can identify other support or resistance points. Many of the principles applicable to support and resistance levels can be applied to trend lines as well. In other words, look for possible support or resistance on any of the trend lines.
- I draw my trendlines differently. I draw a line that connects as many reversal points as possible. This is not an accepted manner of trendline drawing but I find it is quite effective. I frequently will look for a peak or bottom further back in time that might line up with a trendline that I am considering. This lends credence to the considered line.
Up Down Volume Line
- This is a running total of the daily net volume (up volume minus down volume). As it rises it indicates investors are net buyers of stocks on a volume basis. When it falls it shows investors are net sellers of stocks (volume basis).
- It has on occasion been an early indication of a peak or bottom and can be a valuable tool.
Waterfall Decline
- A steep correction that is often seen in the later stages of a correction, frequently step 3.
- A waterfall is followed by a corrective rally. When the rally is finished usually another bottoming decline will take place. This is the second bottom or double bottom. A double bottom can end above or below the prior waterfall low.
- During a true panic, more than one waterfall may occur. For instance during the 2007 to 2009 bear market, there were two waterfall declines. The first occurred in October 2008 and the second in November 2008. There was PANIC in the air during this period as the survivability of the financial structure of the United States was in doubt (scary period). The final bottom action took place in March 2009.

2009 LOW
CLARIFICATIONS
Parts of this glossary have been copied from other places to speedily clarify some concepts.
All content in this section is the sole creation of Bob Karrow. His method of wave counting was conceived in 1976.
All Rights Reserved © ™
————————————————————–
*************************************************************************************************
DEATH OF A GUNSLINGER (3rd important concept)
Remembering humitliy and taming arrogance.
*************************************************************************************************
The section on steps and wave counting are the sole creation of Bob Karrow. His method of wave counting was conceived in 1976.
All Rights Reserved © ™
